Table of Contents
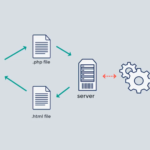
This tutorial with show you how to setup debugging PHP in Visual Studio Code as the code editor.
PHP executable not found error
In the beginning I will also show you how to fix the Visual Studio Code “PHP executable not found” error!
To fix it, you will need to find the PHP folder. Since I am using XAMPP, the path is as follows:
C:\xampp\php
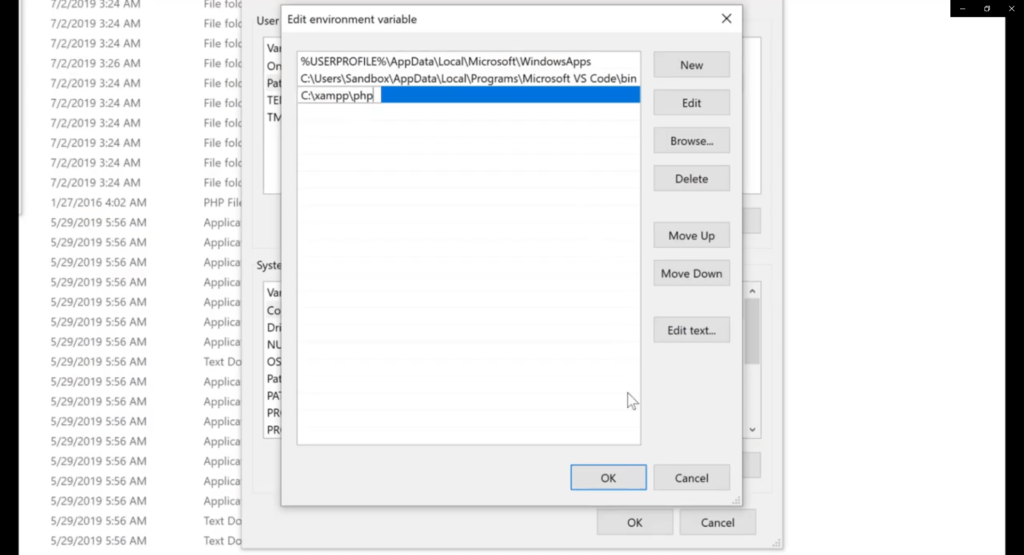
Then, we go to the “Edit the system environment variables” in Windows 10.
Click the “Environment Variables…” button, to open the dialog box.
Then, go to the “Path” line and double click it!
Next, we need to add a new line in the shown dialog box. In the new added line, we paste the PHP path we copied before!
Hit “OK” and close all the dialog boxes and then reopen Visual Studio Code and the error should not show again!
Setup PHP Debugging
First of all, we need to make sure that our XAMPP Apache server is running.
We start the Apache server from the XAMPP control form. Open it and hit the “Start” button in the Apache line of modules.
Open a browser of your choice, and type localhost in the url field. The Apache dashboard should appear. If you don’t see that page, then something is wrong with your XAMPP or Apache server.
If the dashboard is working, then go to the PHPinfo page.
The PHPinfo page gives you all the required information about the PHP engine running on your server.
We will be using the XDEBUG extension for PHP to setup debugging.
You can get this extension in this path: https://xdebug.org/wizard
Next, we need to copy everything from the PHPinfo page and paste it in the input filed provided by the xdebug.org/wizard link.
Then, we click the “Analyse my phpinfo() output” button, which then generates our XDebug download file, which will work with our PHP installation.
We need to get the .dll file and then copy/paste it to this path:
C:\xampp\php\ext
And we are done with that part.
Setup Visual Studio Code
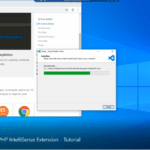
In Visual Studio Code, we go to the Extension section and search for “PHP Debug” extension.
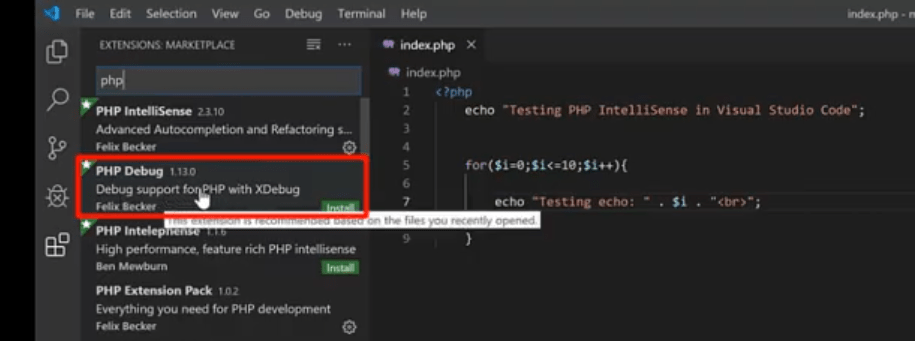
Install the extension!
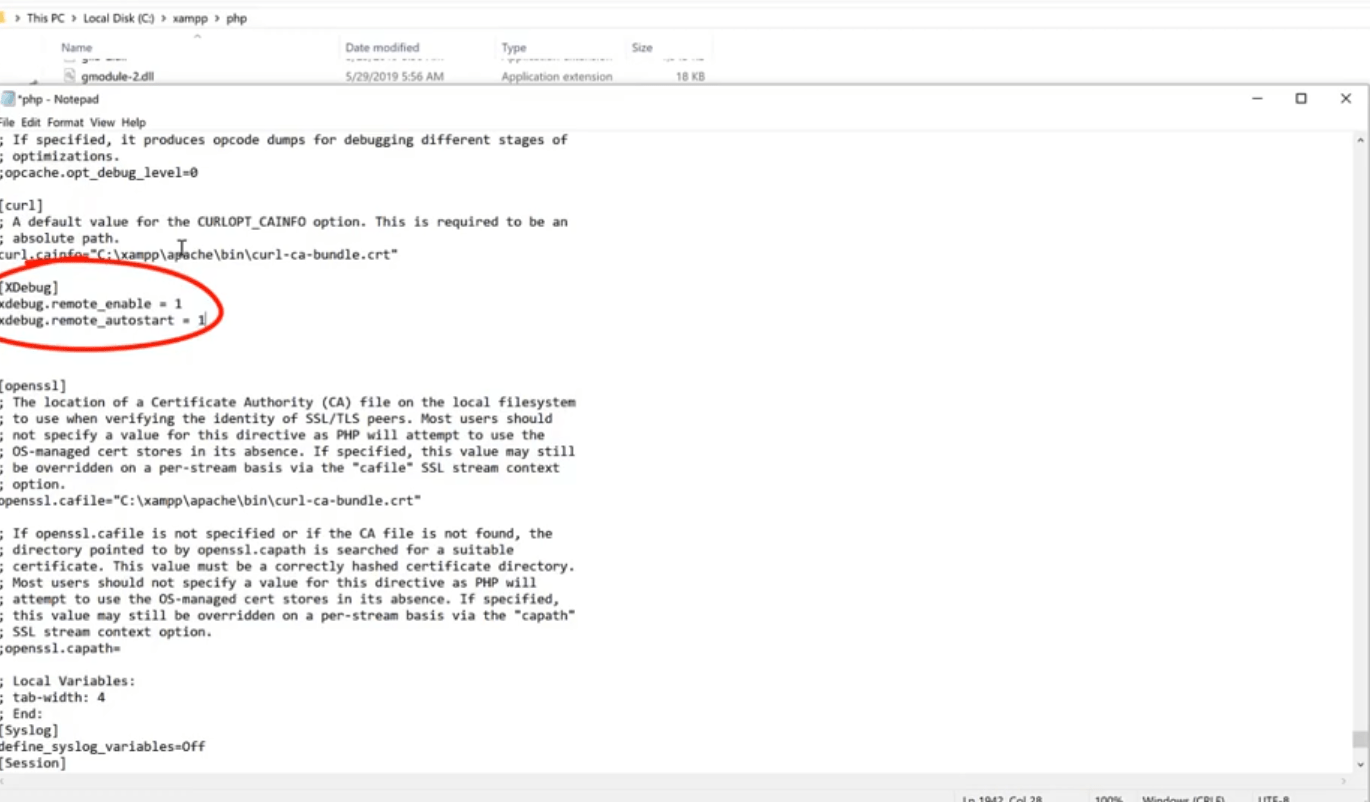
After installation, you need to scroll down in the details section and copy the below lines:
[XDebug]
xdebug.remote_enable = 1
xdebug.remote_autostart = 1
The lines above enable remote debugging.
Next, we find the php.ini (the PHP configuration file).
Open the file and scroll down, somewhere by the end of the file and paste the above xdebug lines that you have copied.
There is also, one more line to be paste in the php.ini file.
If you go back to the browser and the xdebug.org/wizard.php page, you need to copy zend_extension line.
Mine is as follows, but depending on your PHP configuration generated by your phpinfo() page, you might get different results:
zend_extension = php_xdebug-2.7.2-7.3-vc15-x86_64.dll
We paste the above line, below the previous 3 lines in the php.ini file.
The final 4 lines will be:
[XDebug]
xdebug.remote_enable = 1
xdebug.remote_autostart = 1
zend_extension = php_xdebug-2.7.2-7.3-vc15-x86_64.dll
Now, we are all set.
Each time, you update the php.ini file, you need to restart the Apache Server.
We do that from the XAMPP control panel, by hitting the Stop/Start button in the panel.
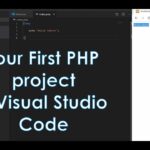
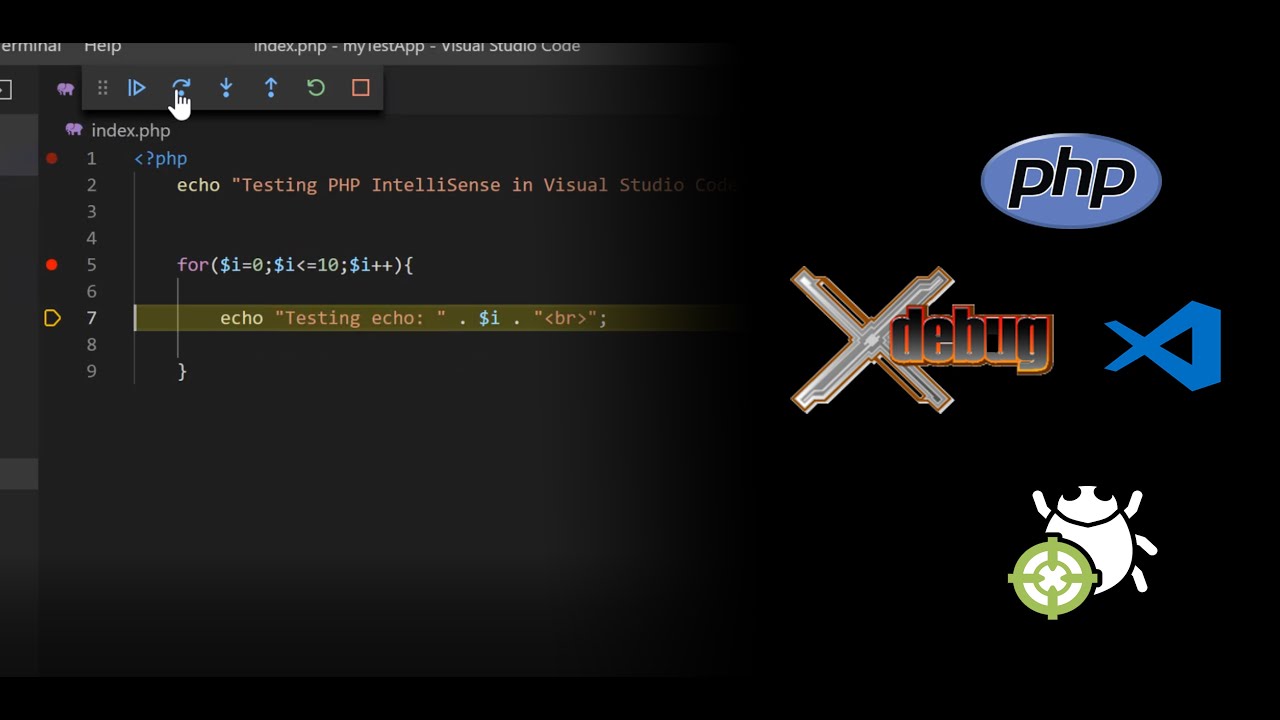
Debugging in action
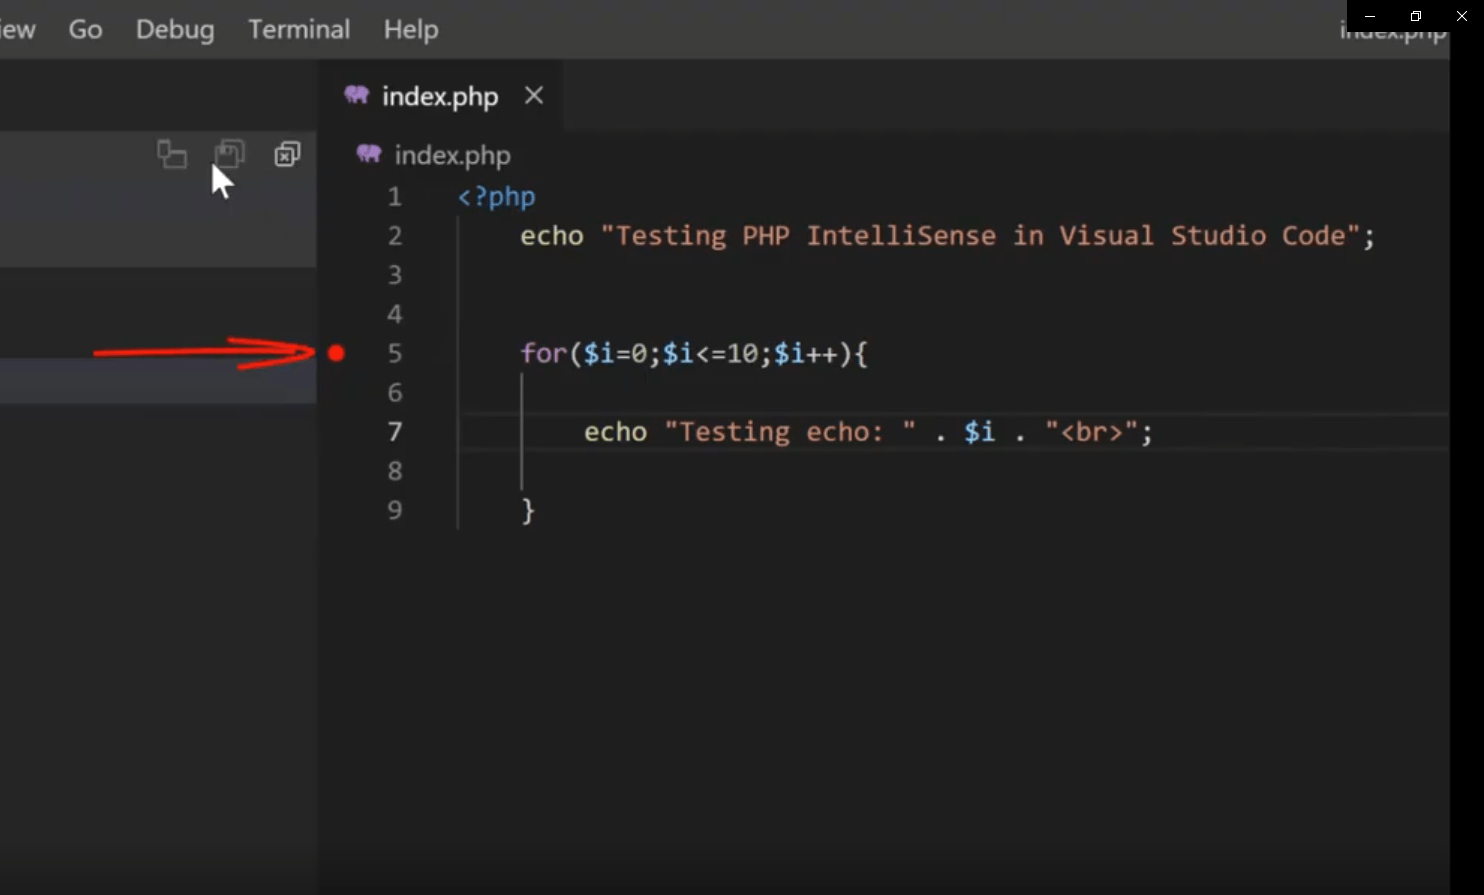
To see debugging in action we need to add a breakpoint in the line of the code we want the debugging to start.
Then we go to the debug extension in Visual Studio Code and we hit the “Listen for XDebug” button, to enable the debugging.
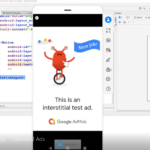
To see debugging in action, we go to the browser and open the php page, we are working on currently.
When the page is opening, when it arrives to the breakpoint we have set before, it will stop running and in the Visual Studio Code we can manually move each PHP code line.
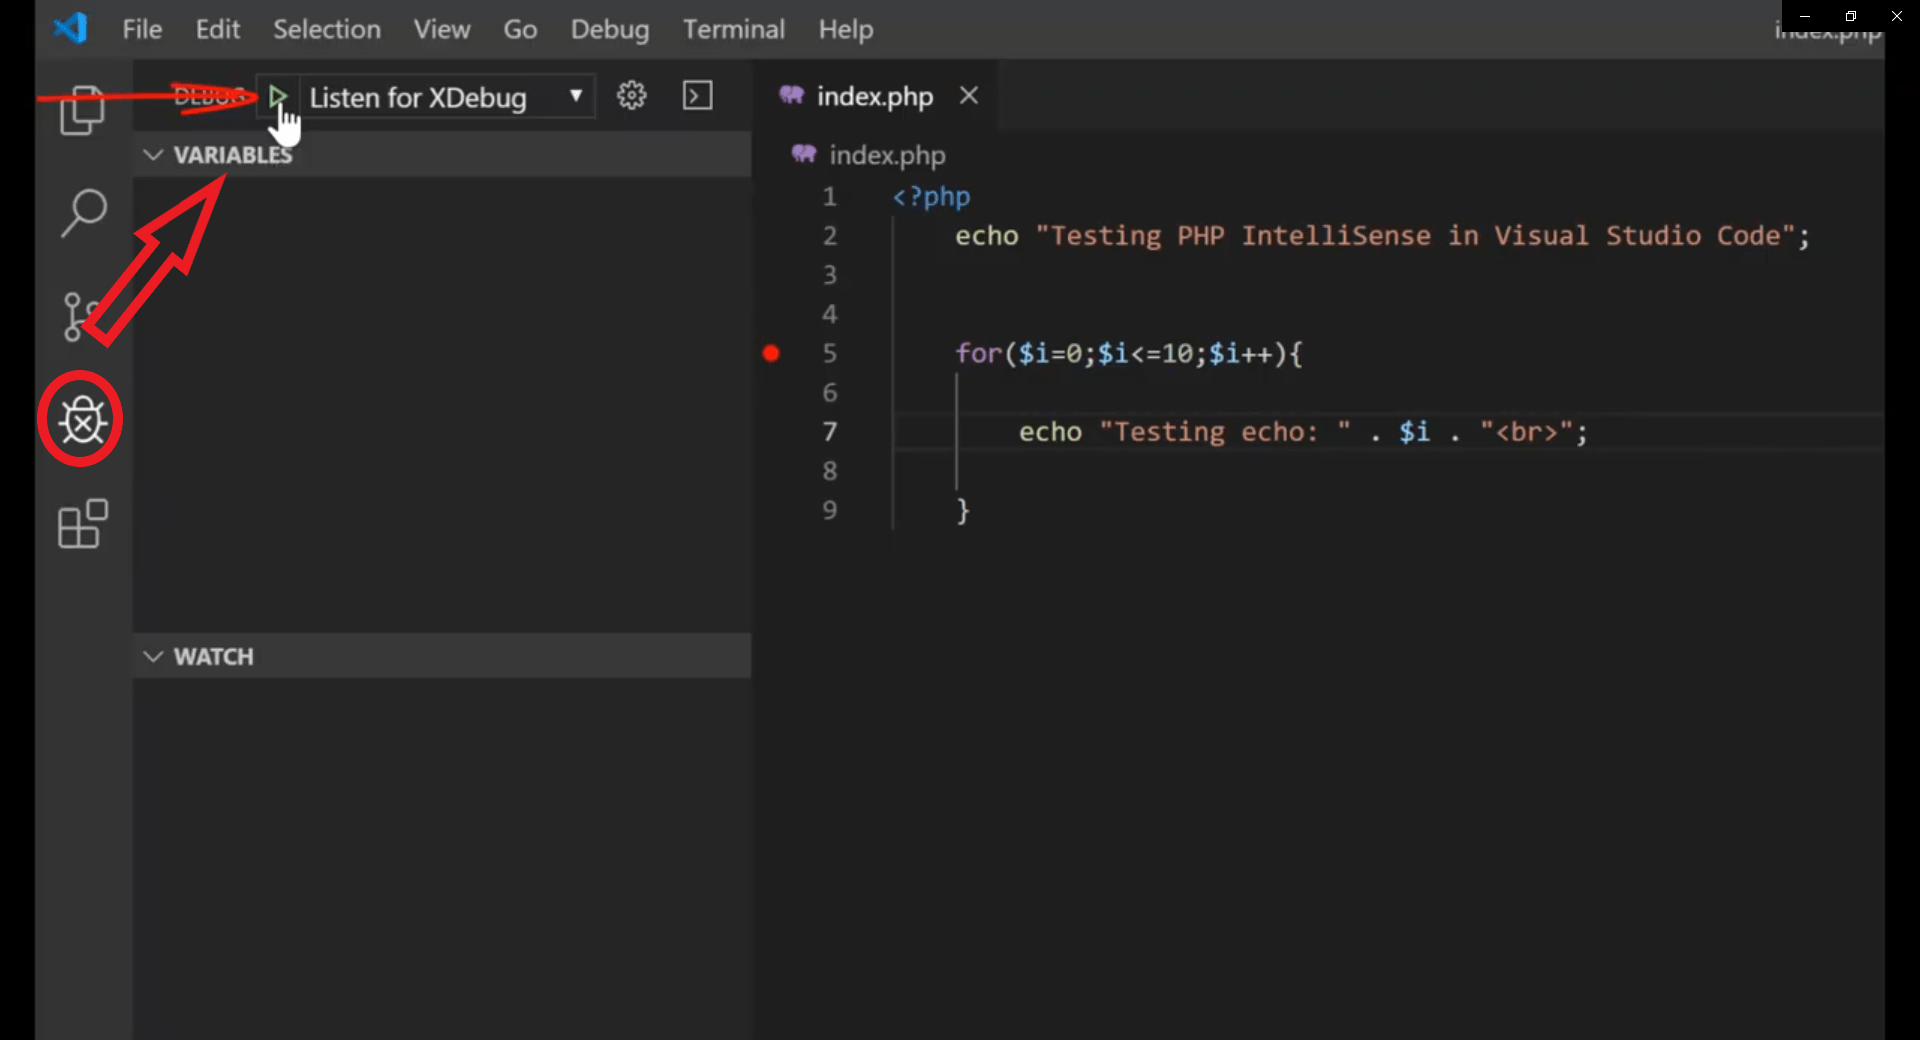
In the left panel in the Visual Studio Code you will see the “Variables” section, where you could watch the local variables, superglobals and/or user defined constants.
To move the code forward or perform any other action, you can use the panel as shown below.
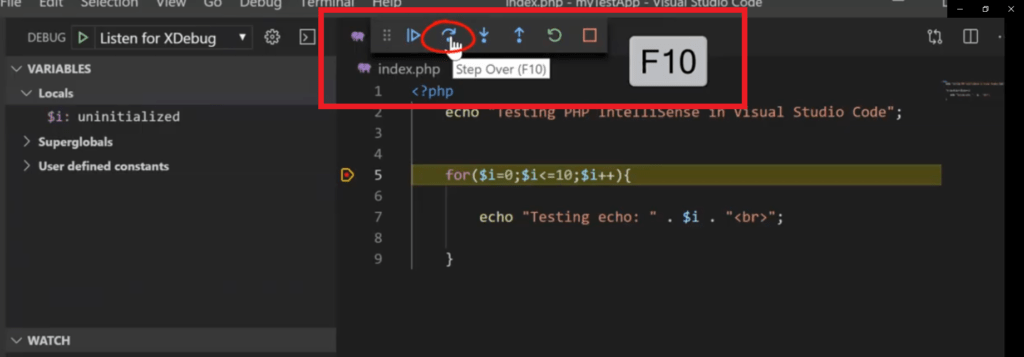
In this way, you will be able to execute the code line by line and see if the code is behaving properly.
In my example I go through a for loop and monitor each executed line and the values we are getting, but you can use this method to debug any part of your PHP code.
Conclusion
The XDebug is not the only tool that allows PHP debugging, but I find it to be one of the best tools for that purpose.
It is always recommended to do debugging while you code in PHP, as you will be able to find any possible errors much quicker and easier and it will help you to produce bug-free PHP code.
This concludes the tutorial, hopefully this was useful to you!
Thanks for visiting us.
![]()